Road Load calcs for Fuel Economy Improvements

xctasy

5K+
VIP
USmpgversesFrontalArea.jpg


Rules 1.

Fuel consumption drops in proportion to frontal area.

Rule 2:

The formula for fuel useage on a level road when weight is added is

(the scale factor of weight gain X 0.2806)+0.7194

A car optimised to reach 75 mph at just 1.25 tons all up will see up to 60 mpg with a super low drag body and a small cross sectional area.

When you go to a much wider, taller vehicile , and have a blunter shape, you cannot expect to get more than 10 mpg at 75 mph.


This graph is one complied with all the road load (transmission losses, rolling resistance, air drag, weight, and sea level air density, but no gradient or road surface factors)


Generally, a good , well tuned engine under full load will use a 0.45 pounds of fuel, per road hp, per hour. It's pretty easy to find out how much fuel you'll use.

At 75 mph, an Econoline won't give better than 10 mph with a truck having a 44 sq ft frontal area and a 0.7 drag coefficent. cdA is 44 x 0.7, or 31. Reading off the 31 figure, you can't expect to get 10 mpg, even with only 1.25 tons.

Each time you add weight, the fuel consumption drops by a factor.

Having a tare mass of 5500 pounds ( 2.5 tons) means you have a wieght increase factor or twice the curve above.


At 75 mph, the fuel consumption falls off at the rate of (2 x 0.2806)+07194, or 1.28 times the fuel use.

That 10 mpg with 2750 pounds will drop to 7.8 mpg in a 5500 pound truck.

Rule 3.

Power Loss due to axle gearing rise is very small. You take the gearing rise as a fraction, and multiply it by 0.1346, and then add 0.8654. That gives you the amount of power you loose with a gearing increase. in some cases, a gearing rise improves power due to a reducton in wheel spin or gear changes over a standing 1/4 mile.

Rule 4.

Adding an Overdrive or making top Underdriven.

Adding or subtracting a gear generally results in a proportinal rise or fall in economy.

A 1.294 growth in gearing by having a 0.77 over drive results in a 1.08 times greater mileage figure at 60 mph.

That is (Overall rise as a fraction x 0.2721)+0.7279

Rule 5.

The hp required for an given speed is calculated below but you must know the tire size in mm, the cd and FA.

Formulae for power due to drag and drivetrain loss is then able to be worked out with ease.

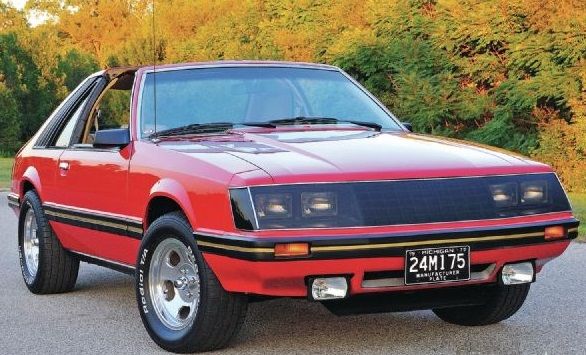
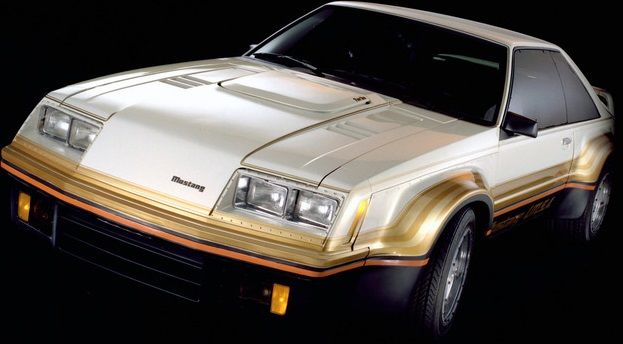
cd is the drag factor. A Pinto is about 0.48, an intermediate Falcon (66-70) about 0.48, a Thunderbird 0.35, a Fox Mustang 0.44 or 0.36 if its got an SVO body kit. Early 60's XK Falcons are quite slippery before the T-bird roof get things messed up...more like 0.40 than the 0.48 or so of a 65 Falcon. Early Sprints were likely to have the least drag.

FA is the frontal area. Then multiply cd by Frontal Area Note that a Pinto is about 20.2 ft2, an early (late 60's) intermediate Torino/Fairlane is 24.2 ft2, and a fat bodied Mustang (71-73) about the same. A Fox Mustang is around 20.8 ft2. A Maverick could be as low as 21 ft2 for an early tudoor, or over 21.5 ft2 for a post 74 dodgem bumper number.

cd*FA *mph*mph*mph * 1.27
. 147733

Then add tire loss

mm*lb*mph*8
. 58 036 680


Rule 6:

The Hp loss or gain due to grade is

perpendicular rise/ horizontal run x lb x (mph/375)

This is the amount of power to add or subtract from the speed formula above if going up hill or down dale.
 
8) interesting saying that an econoline wont get more than 10mpg at 75 mph, i can say that is wrong. my dad had a 71 econoline with a 302, and it got 18mpg at 70(i seriously doubt that 5 more mph would drop mpg by 8mpg), and a friend of mine had a 76 econoline with the 351w that got 17 at 70mph, again i doubt that mpg would drop by 7mpg by upping the speed by 5mph.
 
Cool. I'll re-check the formulae.

Basically, the horsepower consumed at any given speed is part areo, part road drag, part weight and part drive train.

I based it on a BSFC of 0.45, and then looked at how many miles per gallon that was at 75 mph.

I'll show my written workings, and see if I can also post David Vizards 1980 article.

Could be I've over estimated drive train losses or aerodynamic drag, but one things for certain, if you can calculate the power used up, you can calculate the amount of fuel used.

I'll be back!
 
You were right, I was wrong.

I've recheck it all, and yep, there was an error.

Sorry about that. Hate making mistakes.

1. BSFC is supposed to be in gallons per hp-hr, and I had used pounds per hp -hr.

2. Then, to add insult to injury, I was out a factor of ten with the BSFC decimal. I was using 0.45, not the more common 0.045.

E 350 has a height is 83, width 79. The truck has a surface area (by planimeter, scaled) of 38.8 sq ft, and I assumed 0.6 as a drag factor.cdA is 23.3 . Weight is 5500 pounds

The tires are 235's,

Road load HP is


cd*FA *mph*mph*mph * 1.27
. 147733

Then add tire loss

mm*lb*mph*8
. 58 036 680

The road hp at 75 mph is 102 hp, with 88.7 from the body and drive train, 13.2 hp from the tires.

102 hp needs 0.045 X 10², or 4.59 gals of gas to do 75 miles in an hour.

4.59 gals of gas is per 75 miles is 16.3 mpg

Basic calcs are

75
0.045*102

At 75, 16.33 mpg with 102 hp road load.
At 70, 18.39 mpg with 84.6 hp road load
At 65, 20.84 mpg with 69.3 hp road load
At 60, 23.77 mpg with 56.1 hp road load
At 55, 27.28 mpg with 44.8 hp road load.

I'd say any highway at 75 figure will be the same as the calculation in the graph above.
 
I'll do an example of this, but first I'll state generally the procedure.


For an engine I'm tuning, I have a 350 cfm 9117 Holley 2-bbl carb in a 1964 Ford Ecconoline. Only problem is, I don't have it here in NZ, so I have to tune the power valve on a car of similar weight, and then factor in the road loads. I can do this by adding a roof rack and box of a similar cross sectional area to make it the same as a Econoline van.

The Cortina I'm using to test the engine is a 1979 station wagon with drag factor of 0.45 and a frontal area of 20.44 sq ft. Cd A is 9.2. The Ecconoline is quite clean through the air for a van but cd would still be about 0.50, with a frontal area of 33.88 sq ft, and cd A of 16.9.

So the carb and engine end up having to do the work ascribed to 83% more air drag at any given speed.

The car has a US AOD with 4-speed overdrive, 2.47, 1.47, 1.00 and 0.67:1 gears driving through a 3.7:1 gearset to P205/60 14 tires.

All I have to do is work out the road loads based on a 3000 pound car with 205 section tires and then do some calculations. The factory power curve is this:-

XFPOWERCURVE.jpg


If we
a) know the road load, (calculated from a road map with percentage grades given)

and

b) know the power curve, (given)

c) know the throttle opening (0 to 1 volt)

d) know the air fuel ratio

e) know the engine vacume

then in each gear we can work out a plot of how much throttle opening is needed to maintain station. If we factor in any grade as a percent (say 12% grade), or a few 1000 pounds of extra load, we can calculate its impact on the part throttle vaccum.

An example, the engine has varying fuel air ratios, varying revs per minute, and varing load. These three dimensions can be plotted like this. Wsa111 has already done some full and part load work with his Mustang and an Innovate LM-1. I've used a base chart off the internet, and this is fomed by hooking the factory Bosch vacum sensor, a GM thottle position sensor, a rev counter and a wide angle oxygen sensor to a cheap datalogger.


FalconSixFuel_AirversesLoadandRPMWi.gif


The key issue is where the power valve comes into operation. Vans spend most of there days with the engine at 10 inches of mercury vaccum, but even small increases in speed or grade can push it right into the 8.5 mark with ease. The standard 8.5 power valves are a little too lean for the cruising speed, but too rich when they open. Two stage power valves have a stepped entry, and can be easily used for trucks.

With a road load chart verses the air fuel ratio table, you can find the ideal power valve for any given engine combination, and taylor a load to rpm/a:f ratio table like the EFi guys have to.

This may all sound like a hotch potch of new age goobledegook, but its been done since the second gas crisis.

Example is the table from a Popular Hot Rodding article in January 1981. Table 5, at the end, has a road load calculated fuel consumption.


PopularHotRoddingJan1981RoadLoadTab.jpg
 
i hate to be the turd in the sleeping bag, but on a gasoline engine, BSFC also varies as a function of manifold pressure (vacuum). I know people that have documented as good of or better mileage at 75mph than at 60, consistantly. the only way this can be possible is if the engine is running at such an absolute manifold pressure low enough (much vacuum) that there isn't enough cylinder pressure to effect an efficient burn, yet at higher speeds, when the throttle is opened much farther (low vacuum, high pressure) there's enough charge pressure to burn a lot more efficiently, throwing the curve completely off as far as mileage is concerned. You're spot-on about power required, but just how efficiently that power is made is going to throw a wrench in the works. (also, the taller a viehicle is geared makes an impressive difference, that's the only way i can explain full-size GMs with the 3800 getting 30+mpg while i'm only in the ballpark in a compact 626 with a 2.0 that turns a good 1,000rpm higher at any highway speed.)

the assumptions of the curve are more appropriate for a diesel engine.
 
Ewwweee. Sniff. Nope. No turds in my sleeping bag, sniff, sniff.


1. Gearing

GM admitted in 1981 that the 4-speed THM 200 with a 50% gearing rise in top would have to have run a lower final drive, and only give an 8% fuel economy improvement. That's with a blunt old B-body. The modern cars show a much greater improvement due to the most parasitic losses (tire, air drag, frontal area, drivetrain with front drive) being less on todays cars than they were back in the 80's. A 1980 Dodge Colt (0.39 drag factor) was tested with the SuperShift 8 speed stick shift, and a 29% rpm reduction gave it an 8% fuel efficiency gain at 65 mph. A gain is a gain

Modern cars with the GM 3800 V6 have about 50% less air drag than the old 3.8's in the 78 Monte Carlos, Cutless and Regals. These days, the gearing at 55 mph is locked up in 4th, and the 65 and 75 mph rpm figures move the engine into a more BSFC efficient zone. The air drag and road load increase are very minimal for the extra 10 or 20 mph, unlike the high speed brickwalls 25 years ago.

2. BSFC change as engine load and revs change.

The efficency verses load curve is just as you say! The BSFC varies over the rev rage and engine load, the are not constant.

The engine won't return better fuel consumption because of the car is doing more work, but if your no longer having to be held up by slower traffic if you can overtake without any additional throttle opening.

Another thing. GM found back in the 70's that by either deactivating cylinders or making an engine work harder makes it more efficient. Under closer to wide open throttle conditions, air speed is higher, chamber filling is better, there is more turbulence and better air fuel mixing. The advance curve is often set up to increase as revs rise to above the peak torque, which helps too.

Somewhere, I have a graph for a 1980 Ford Fiesta which maps MPG verses road load and rpm so you can find the ideal gearing to suit. It charts the efficiency like on a turbo graph.

On old brick-like cars with Cd's of 0.40-0.55, you won't get a better 65 mph milage figure than at 55, but you will on many modern cars which are geared only to pass the Federal Emissions cycle, the engines are geared for a moon shot, and the engines are way below the peak torque where VE and efficiency is best.

Over here in New Zealand, the roads are very hilly, and on some favorable gradients (from the inland area to the eastern sea board, a car at 75 mph is much more economical (better mpg) than at 65, because its freewheeling due to gravity.

In my case, the average gradient falls about about 0.4% over 72 miles. Going in the opposite direction uphill, it is worse. This has been noted before by my many drives over the last 20 years.
 
xecute®™© he he":33yjeyc3 said:
1. BSFC is supposed to be in gallons per hp-hr, and I had used pounds per hp -hr.

You were right the first time. BSFC is lbs/hp/hr. Gasoline weighs about 6.5lbs/US gallon. Most naturally aspirated engines run in the .45 - .55 BSFC range. For example, a 200 hp engine will consume about 90 - 100 lbs of fuel per hour at that power level.

However, most cars don't need that much power to go 70 mph. It really only takes 20-60 hp to hold a car at that constant speed on a level road, depending on the power it takes to overcome aero and frictional losses.

Newton's First Law dictates that the inertia of a car alone keeps it moving forward at a constant speed when the net force on the car is zero. Newton's Second Law dictates that when the net force on the car is negative, the car decelerates; if it is positive, the car accelerates. So, to hold a steady speed, you need only overcome the aero and friction.

You can actually get a good idea of what those aero and frictional losses are by conducting a coastdown test. From a constant speed, on a level road, on a windless day, if you time the decelleration to another speed when the engine is disengaged, you can calculate how much power it takes to hold the first speed. Once power is known, you can estimate the fuel consuption at that speed.
 
Cool thread.. maybe a bad idea that I revive it but I just wanted to say that getting BSFC curves for your engine would be a huge tuning advantage. I've seen a few for various vehicles but none for any ford engines. One point that really sticks out though is that they are most efficient at full throttle and usually at a mid rpm range (but I suspect this varies with cam etc).

I've read a good deal of thermodynamics stuff too and this makes a lot of sense. IC engines operate more efficiently as the compression ratio increases. This is shown in a number of ways.. the most obvious is increasing CR for more power with same fuel. When you throttle an engine you are effectively controlling the compression of gasses before combustion. At WOT you are getting the maximum compression of your gasses and therefore a more effective transfer of energy to the pistons. There are also pumping losses etc. from throttling.

This is why disabling cylinders or running a smaller engine makes it more efficient. If we could find a BSFC graph for a 300 or 250 etc. we'd be able to figure out the best gearing/rpm range for cruising.
 
I'm still trying to track down a Ford Fiesta or VW Polo BSFC verses gearing efficency curve.

The graph ends up just like a turbo map, and its really easy to pick the right diff ratio. Every change in gearing results in a different graph of isotherms.

The basic need is for a 200 Mustang graph speed verses BSFC.

a 250 Granada/Falcon graph

and a 300 in truck graph.

Meantime, best we can do is this 1979 Chevy Camaro 350 with 2.73 gears

Fig4.jpg
 
It was CobraSix who talked about necro-ing old posts...this one wasn't sorted to my satisfaction becausse the fuel consumption figures didn't correlate to road load. Since then, I've done a lot more work on it.

I've got a program the calculates open road miles per gallon at any speed, similar to Bowling's and Grippos http://www.bgsoflex.com/mpg.html

His isn't based on
engine capacity or gearing,
it assumes everything is optimized for 100% efficency at the best Brake Specific Fuel consumption around (it is about 0.48 lb/hp-hr at best, but can drop to 0.60 lb/hp-hr, which is 0.074 gal/hp-hr to 0.090gal/hp-hr, while they use 0.0667gal/hp-hr, or 0.43 lb/hp-hr),
and doesn't allow for torque converter loses like mine does (even locked up, there is either slip or extra clutch pack load)

So at 65 mph, you won't get the 24.91 mpg they claim at 65 mph, or the 25.85 at 62 mph in every engine combintion.

Example Bowling's Vehicle MPG Estimator

Input Parameters Are the Following:
Coefficient Of Drag = 0.4800
Frontal Area = 20.8 Sq. Feet
Vehicle MPH = 62
Vehicle Weight = 3200 Lbs.
Tire Pressure = 32 psi.
Brake Specific Fuel Consumption = 0.0667 gal/hp-hr.
Drivetrain Horsepower loss = 12
Computation Results:

Computed Drag + Drivetrain Horsepower is 36
Engine Fuel Consumption is 2.40 gal/hr
Engine MPG 25.85

As an estimator, though, is a great bit of program!

My program only uses 62 mph at the moment, but that will change soon, as it based on an Aussie total Fuel Run's Internationl Efficency Formula which uses a default 0.44 drag factor and 20 sq ft frontal area, similar to the Australian Standard and EPA calculations, and I don't want to rearranged the 12 inputs to suit any speed just yet.

On another site, we were busy calculating the improvment in mpg from the application of an AOD to a 400 Ford powered station wagon.

What we had was a stock six cylinder car with an AOD, 3.08:1 7.5" diff, and the prospect of shoeing in a 172 hp at 4000 rpm 400 Ford with 298 lb-ft t 2200 rpm in it.

We did a suite of valid 7.5" diff ratios from 3.45, 3.27, 3.08, 2.73, 2.47 and 2.26, with a C6 and then an AOD with 3.08 gears.

So I ran the numbers in lock-up clutch 4th with the AOD, 400 and 3.08, and i got 20.3 US mpg at 62 mph by my calculation. The overall gearing with 3.08 diff and 0.67 overdrive is 2.06:1
The C6 with 3.08 gears gives only 13.7 miles per gallon because of the torque converter slip.
With 2.73 gears, it gives 15.0 miles per gallon.
If you could make a set of 2.47 or 2.26 axle gears survive, 16.1 or 17.1 mpg at 62 mph, respectively.

Just for fun, I added a 2.06:1 diff and got 18.3 mpg with the C6 and 400 Ford

If you drive everywhere at 65 mph, you'll save 45% at least on fuel with an AOD verses the C6, the 2.06:1 overall gearing is alone worth 18.3 mpg, or a saving of 34%, but the lock-up clutch is a worth 11%.

172 hp in a Fox can make it top out at 123 mph with the 3.08 gears and AOD, and that's the iceing on the cake.
 
tuning my SEFI setup the A/F fuel load chart like what you posted tried to find info on what % of load = what vacuum reading. Wanted to relate this to carb setups. Never found any info.
 
turbo2256b and others. There is a road load verses engine load resolution, David Vizard did it above. The engie has to be dynoed, it has to mege steady state road load with dyno road load. A dyno uses a different revs per second load case than the LA Basin and Euro 12 mode emissions cycles. Its able to be resolved fairly easily.


I'm journalling my progress at http://ecomodder.com/forum/showthread.p ... 965-2.html

and http://vb.foureyedpride.com/showthread. ... tIMSA-time.

That way at least all my mpg improvements will be logged and discussed. With people who, like Ford Sixers, are no slouches and won't let me away with impossible statements.


What I can say is that with a 40% aero reduction, that makes an 11% saving from 56 to 75 mph on a 135 hp automatic Fox style compact or intermediate in the 2750 pound range. That's using the US and European emissions steady state cycle data from Audi.

For example, in instances where an engines automatic transmission spec and gearing wasn't changed, the same 135 hp, such as in Europe, the Audi 5000 got a near 40% reduction in drag (0.32 verses 0.44), and it saved 11 % fuel on the highway cycle, 2.1 US mpg at 56 mph, and 2.6 mpg at 75 mph, and it got an extra 5 mph top speed.

I'm on the way to a planned 71 % reduction in aero drag from 0.445 to 0.26 hopefully with my ecomodded Mustang. Fuel consumption should go from 27 US mpg at 55 mph to 45 US mpg at 62 mph with overdrive and that drag factor reduction.

What is now called my DaytIMSARSX-iv project continues, as its part 79 Mustang Daytona, Part 1980 IMSA, part Mustang RSX, part Probe IV.

1. It is part I like from the 1979 Mustang Daytona show car


Its a polycarbonate nose cone cover. Over here, the Aussie Commodore SL/X bright work nose was a production copy of the polycarbonate front Ford used on there six Fox showcars.


The Daytona system covers the DOT spec non replaceable bulb quad lamps in smoked perspex plastic. Smoked plastic is not, but covers are legal in New Zealand. Based on the aero improvement on 1983 Falcons and Mustangs, a full front block -off of lights and grille should be a drop from approx 0.445 to 0.39.

2. Then curtain walled side perspex, aka 1980 Mustang IMSA showcar.


IMSAtiltwindsowsversesRSXboothwindows1.jpg


MustangIMSA1980CarampDriverMARCH1980.jpg

Based on the Renault Vera concept verses the R18, that is worth a 20% drag reduction, or approx 0.325.

3. The tilt windows of the showcar aren't practical for me, so I'm going to slot the belt line, and join polycarbonate booth windows to the existing power windows, so the curtain walls are just cladding. It will end up with a 1980 Mustang RSX showcar or production De Lorean style which copied the RSX booth window on each side.

4481044881980fordmustangsxconceptcarnegcn27348004.jpg


4. Under body and wheel mods as per Probe IV. To save cost and service issues, the underneath of the car will get a David McMillan Honda CRX land speed record realty property sign to cover the underbelly totally. I think that will take down the drag factor to 0.26 without any other changes.

I do need to go to 240 section front tires on Gotti three piece rims, which will get covered with flush see through perspex. I'm still looking at 280's on the back, so I'll most likely need the SVO wheel spats.

1_gotti_felge6_g_1.jpg


Then I'll fashion up a legal cycle car front fender with metal and persepx, linked to the kingpin upright/axle spigot. The stock TRX wheel package can take tires anything between 190 and 240 section, and as section size goes up, so does aero drag, so the mod will probably be a minor drop in drag with the planned 240 section tires, not a major drop. The cycle car front covers are to be Probe IV style.


The funny thing is that Daytona, IMSA, RSX, and Probe IV were all 79-83 era technology in keeping with the era of my 81 Fox platform, and the production engineering was really totally done on those four cars, so its a total copy of Ford project car technology.


I'm looking at the road load calcs, and with a 71% drag reduction, a 200 Mustang with four stage auto and 2.73 gears with 0.67 top gear should do 45 US miles per gallon at 62 mph, and 139 mph needing just 153 hp.
 
Back
Top